Monitoring the Monad Testnet is no longer a passive exercise; it’s a necessity for developers, node operators, and enterprise teams seeking to ensure high throughput and robust validator performance. With Monad’s architecture pushing the limits of EVM parallelization, even minor lapses in validator uptime or spikes in transaction load can have outsized impacts on application reliability and user experience. In this environment, precision monitoring becomes a strategic advantage.

Monad Explorer: The Official Block Explorer
The Monad Explorer serves as the public window into the heart of the testnet. This tool allows users to inspect block production, transaction histories, and validator activity in real time. For teams building on Monad or tracking specific validators, the explorer provides transparency into block propagation times and finality. Its granular data on transaction status helps identify bottlenecks or failures before they escalate into larger issues.
Grafana Dashboards for Monad Node Metrics
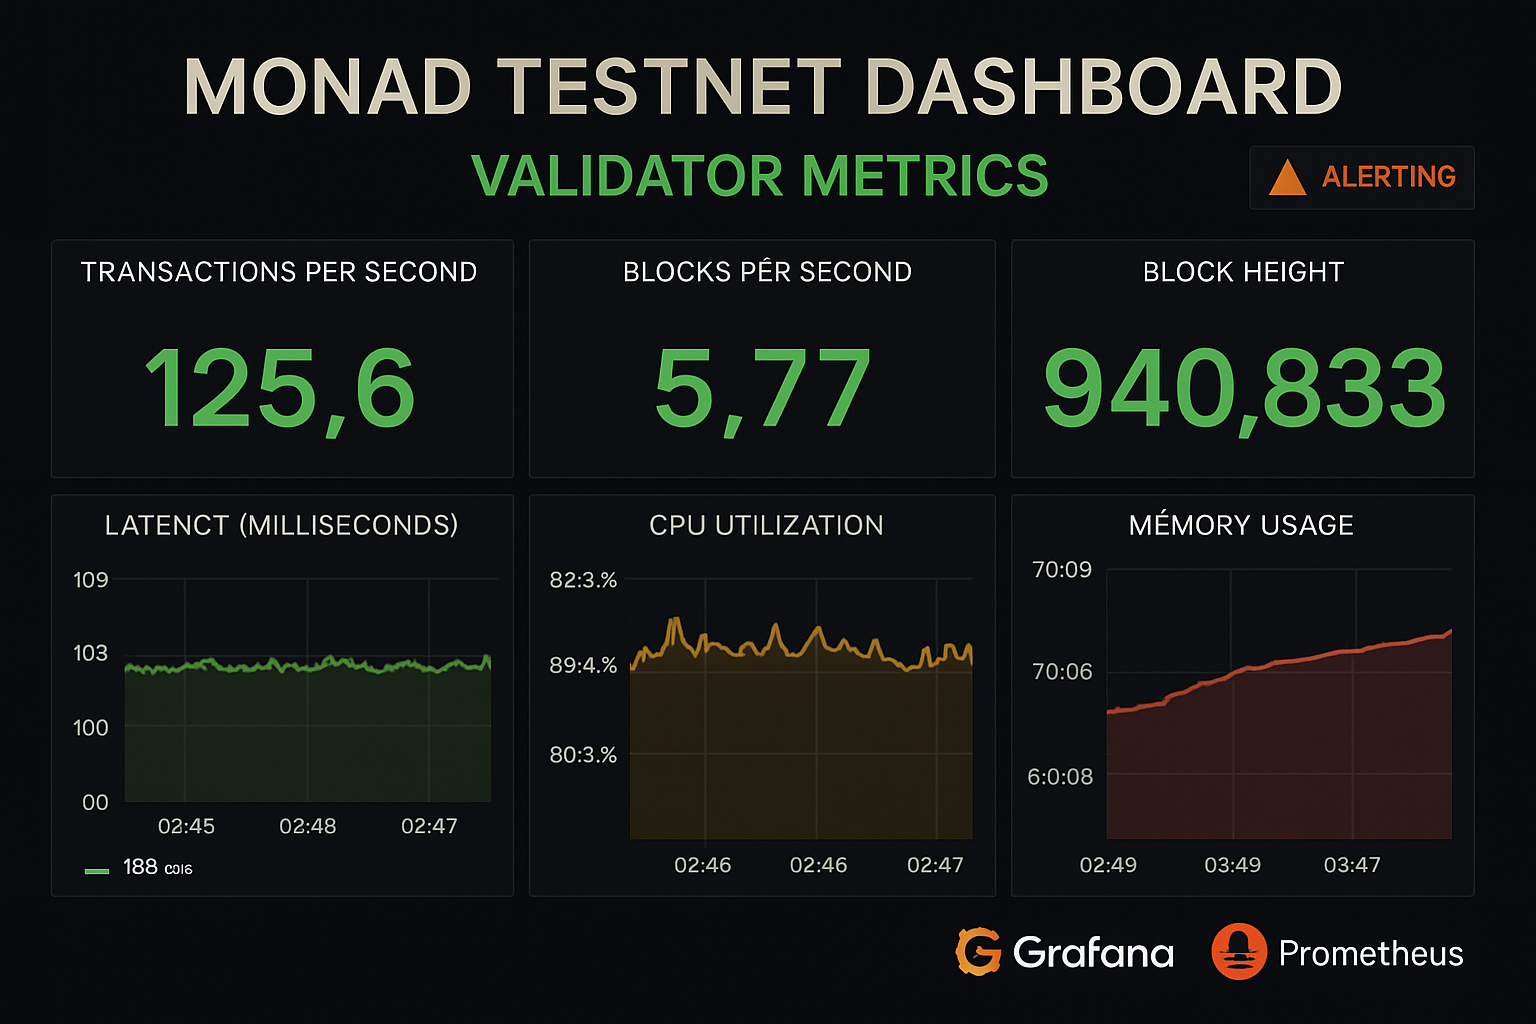
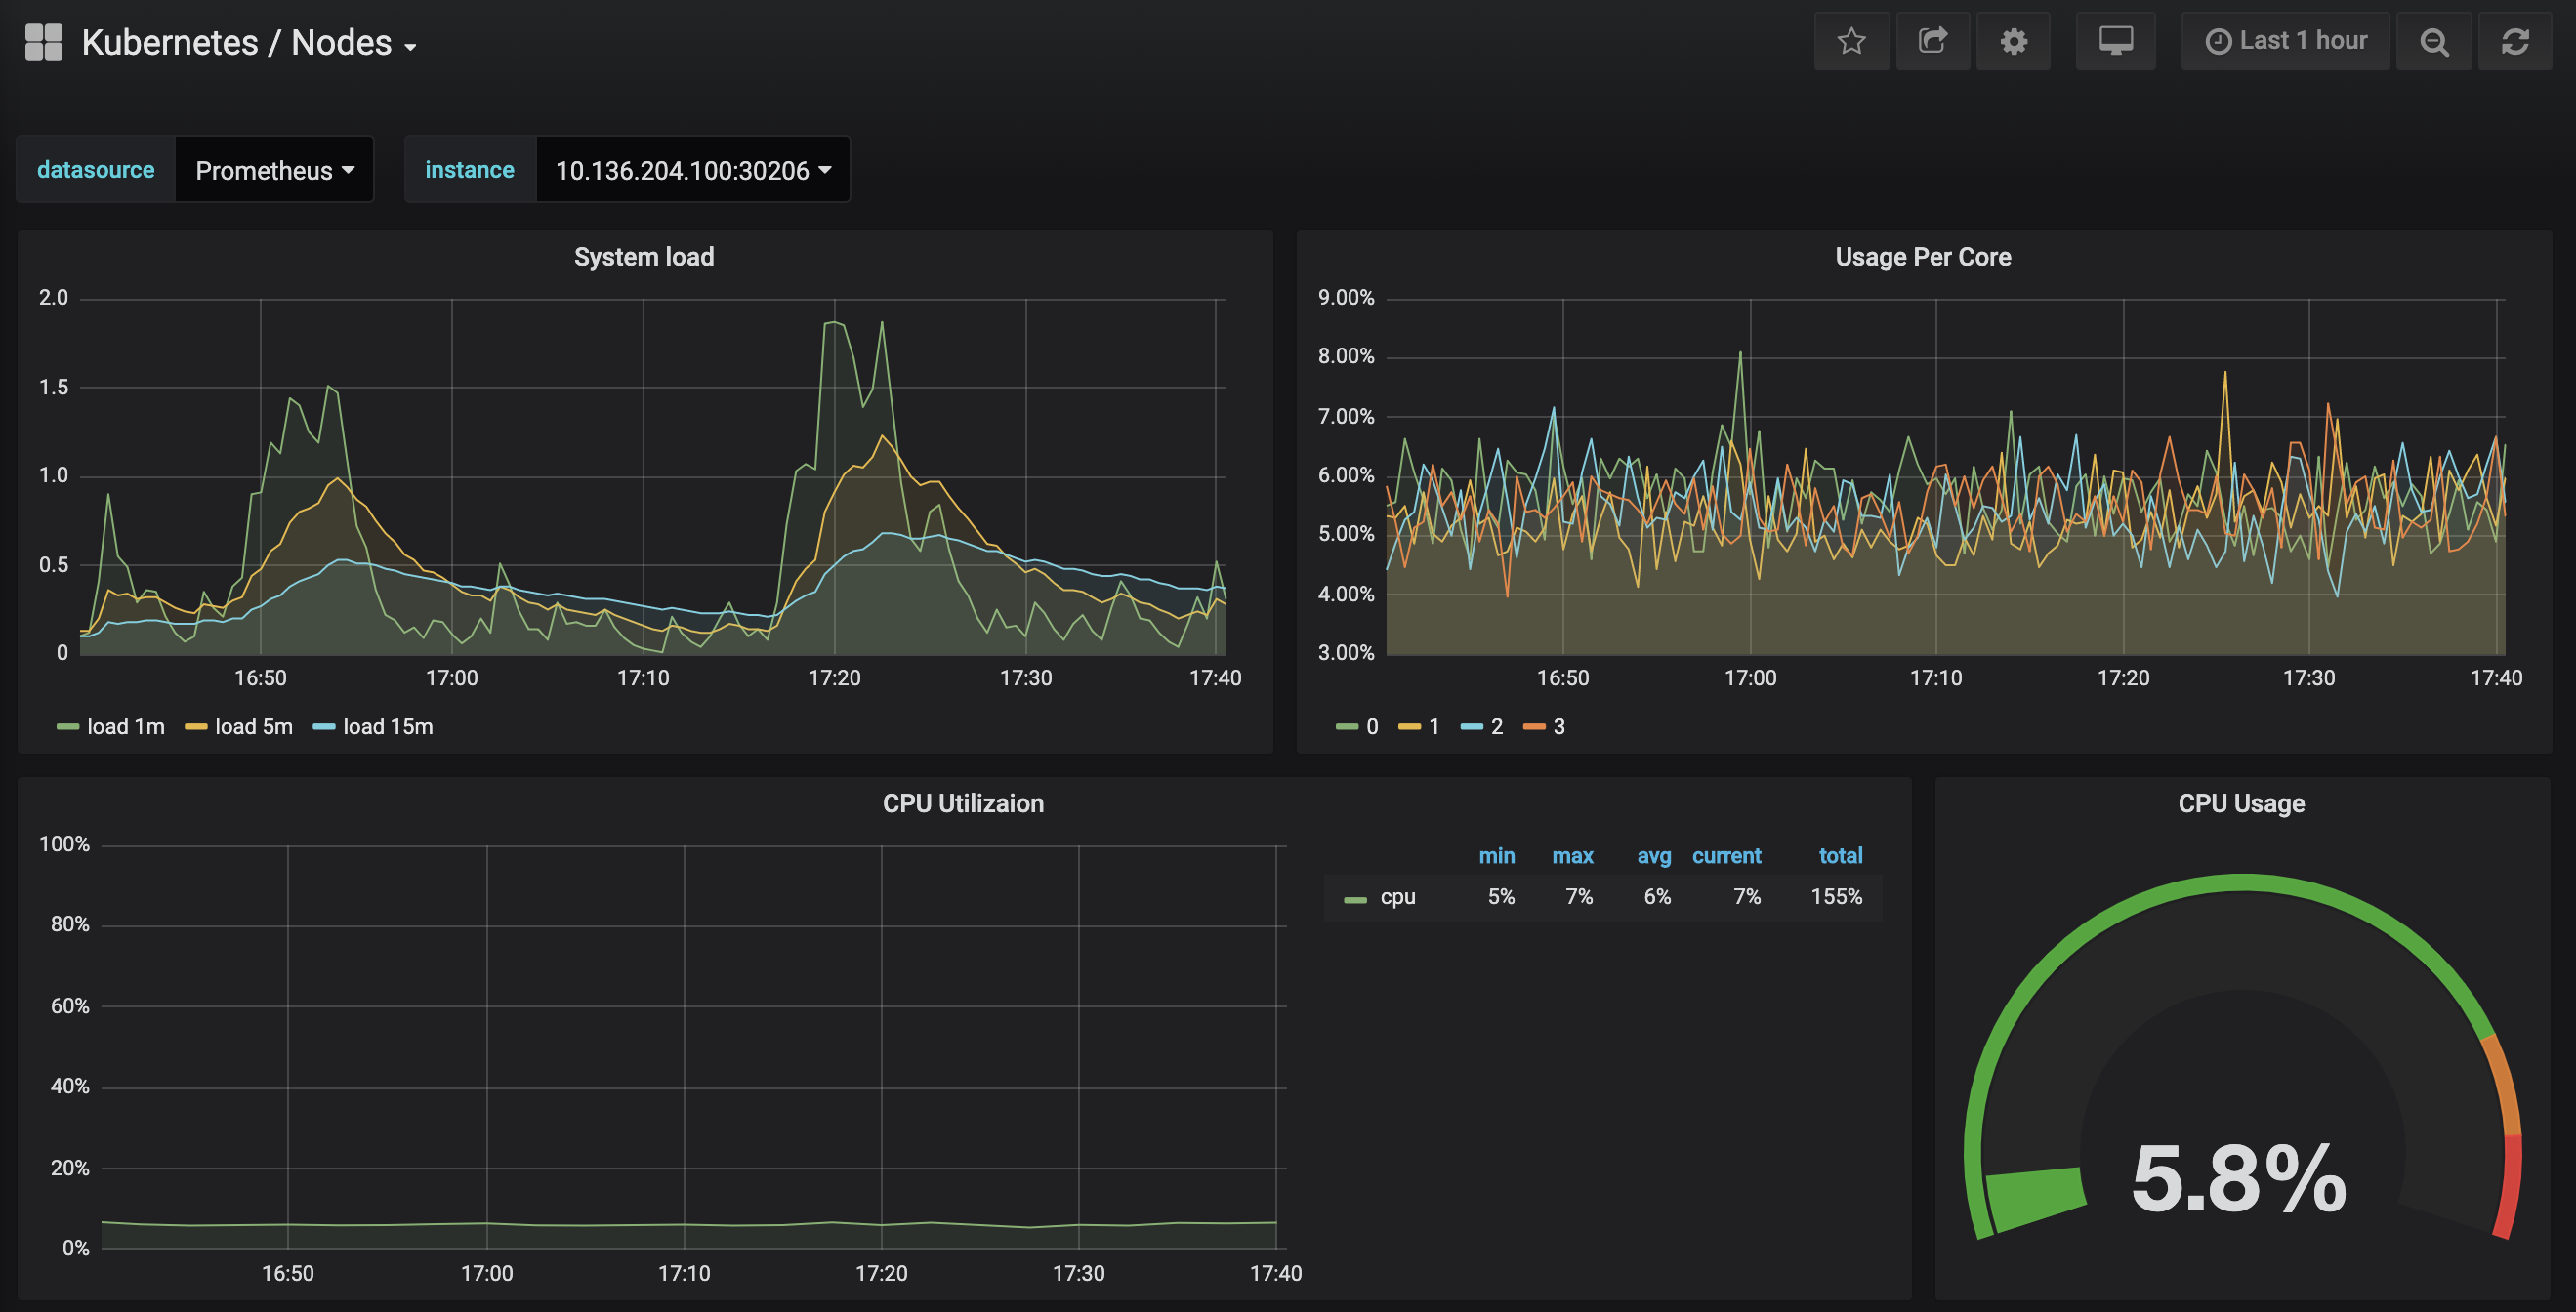
No serious operator should run a Monad node without integrating Grafana dashboards. These dashboards aggregate a wealth of node-level metrics – CPU usage, memory consumption, peer connectivity, block proposal rates – all visualized over customizable time frames. By layering Grafana atop Prometheus data sources, teams can spot trends such as rising latency or memory pool saturation well before they affect end users. This observability is especially crucial during periods of rapid protocol iteration on testnet.
Top Tools for Monitoring Monad Testnet Performance
-
Monad Explorer (Official Block Explorer): The official Monad Explorer provides real-time visibility into block production, validator participation, and network health. It enables users to track block confirmations, validator status, and transaction details, making it essential for monitoring throughput and validator churn. View Monad Explorer
-
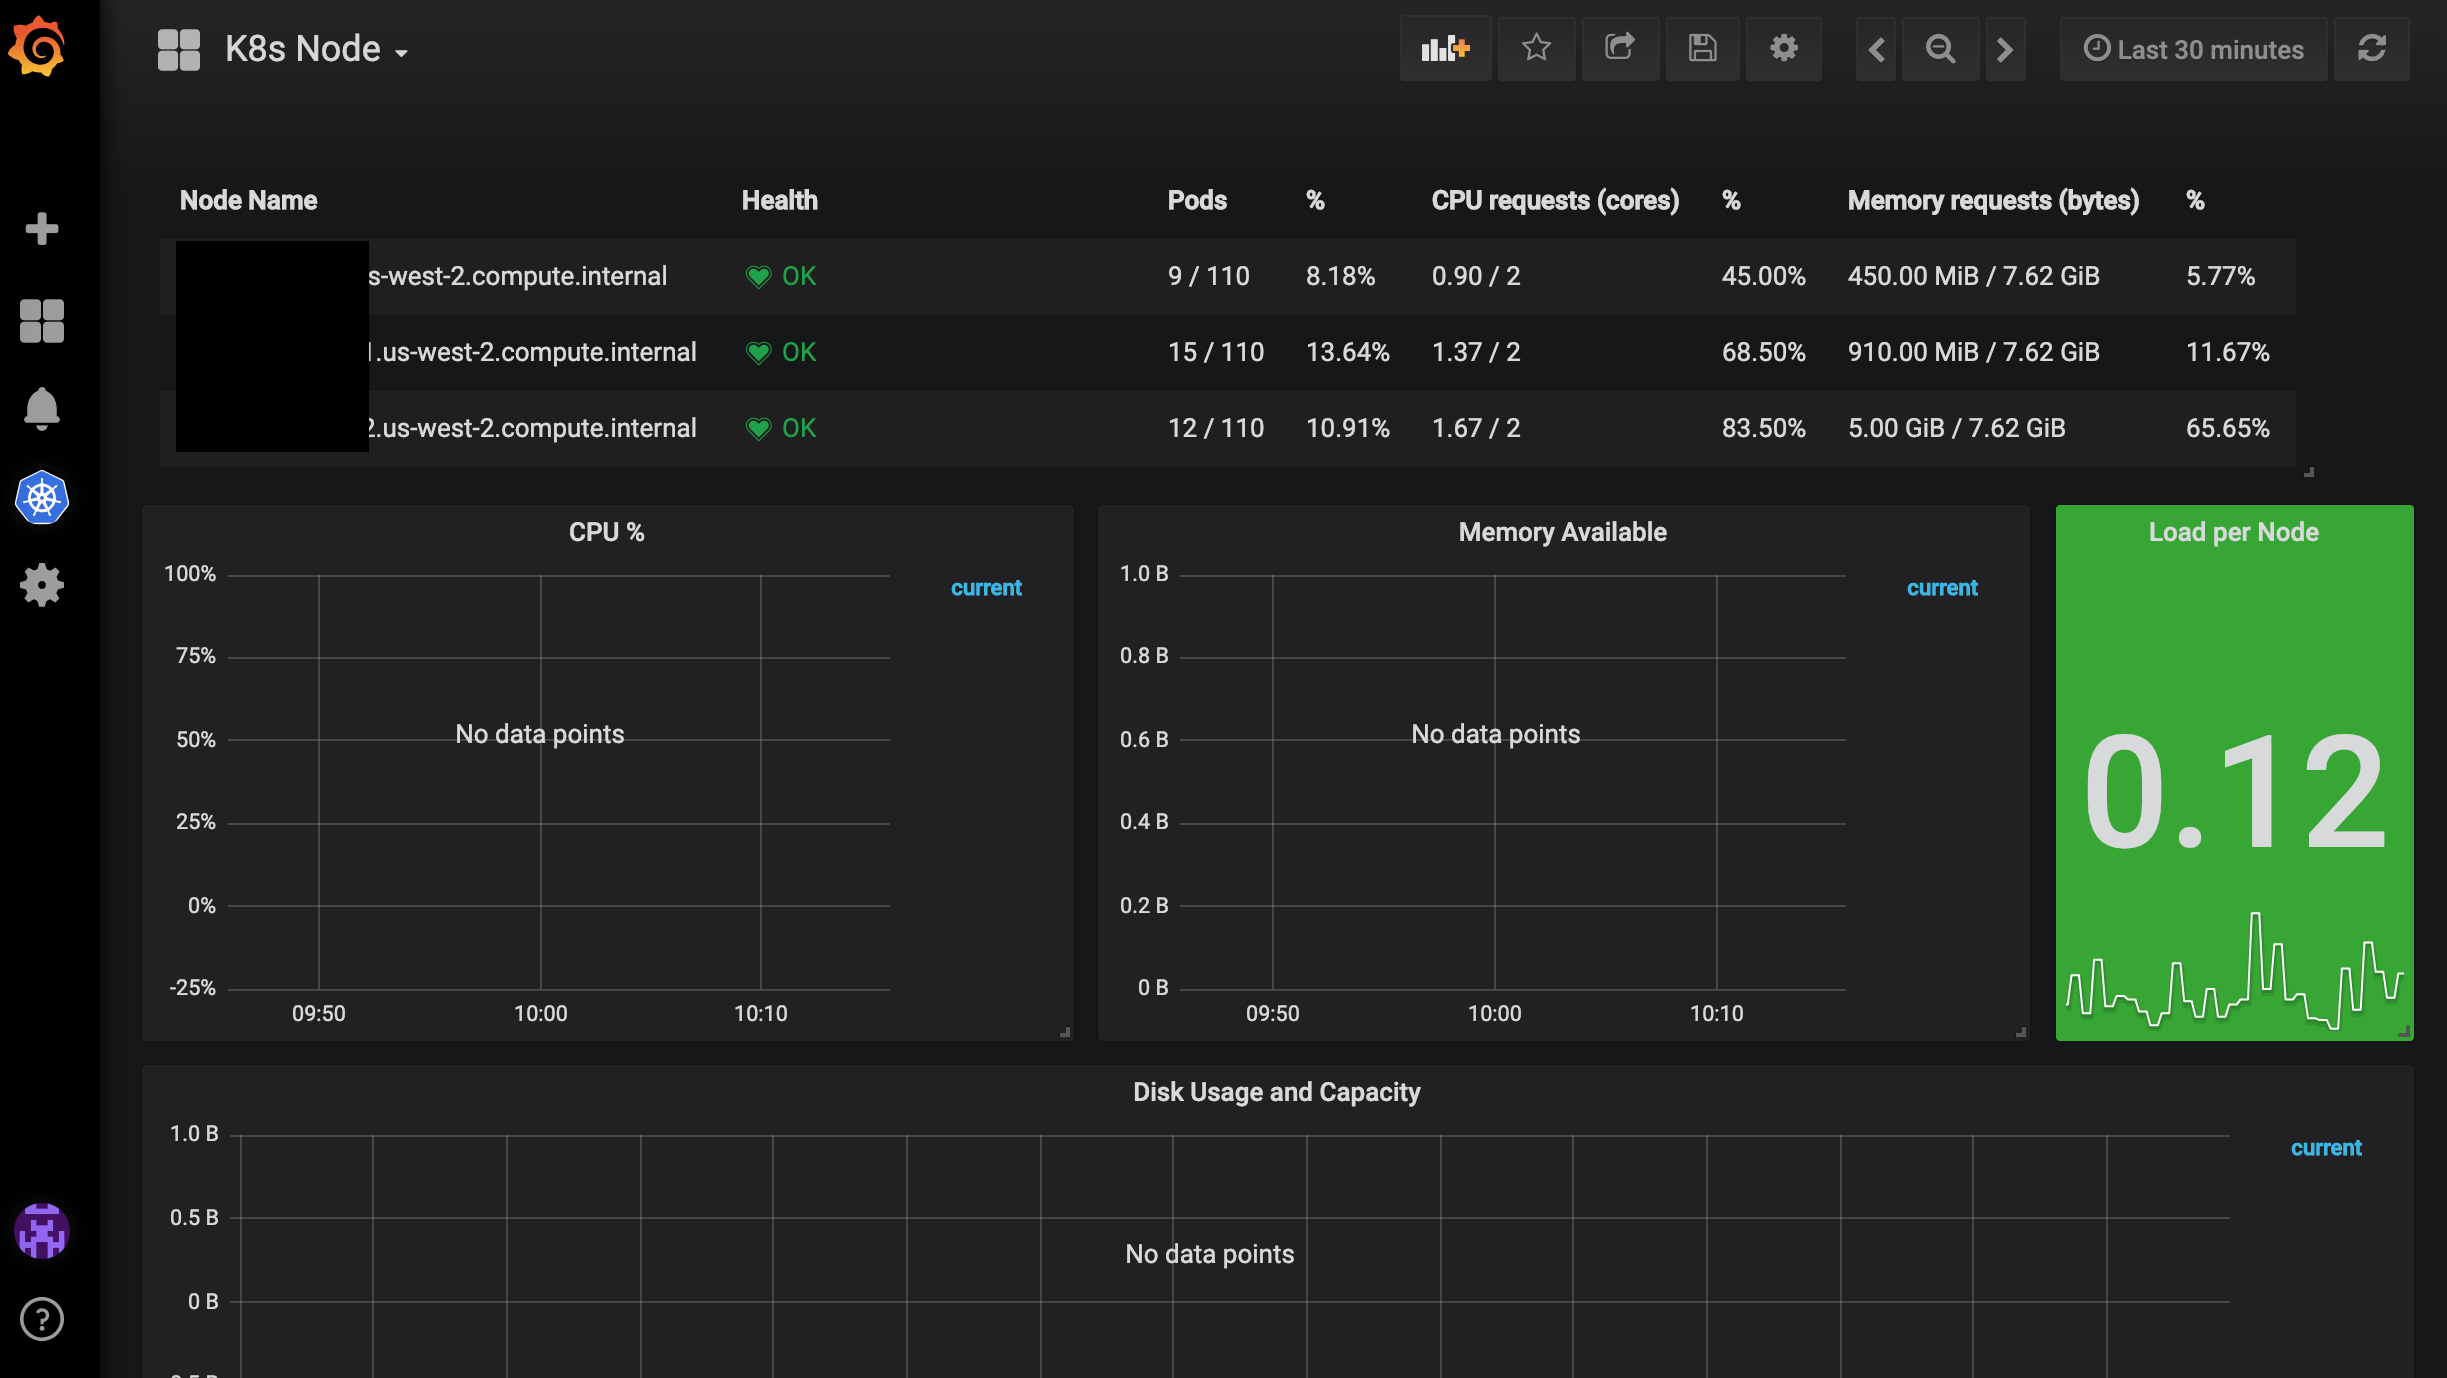
Grafana Dashboards for Monad Node Metrics: Custom Grafana dashboards can be configured to visualize Monad node performance metrics such as CPU usage, memory consumption, block times, and peer connectivity. These dashboards help operators quickly identify anomalies and trends affecting network throughput.
-
Validator Uptime and Churn Rate (Custom Prometheus Queries): By leveraging Prometheus with tailored queries, node operators can track validator uptime, detect churn events, and analyze participation rates over time. This approach supports proactive management and helps maintain network stability.
-

Transaction Throughput (TPS) Monitoring via RPC Stats: Monitoring transaction throughput using RPC endpoint statistics allows for accurate tracking of transactions per second (TPS), block latency, and network congestion. This metric is vital for evaluating the testnet’s performance under varying loads.
-

Alerting via Discord/Telegram Bots for Validator Events: Integration with Discord or Telegram bots enables real-time alerts for validator-specific events such as missed attestations, block proposals, or status changes. This ensures node operators can respond quickly to issues affecting validator churn and network health.
Validator Uptime and Churn Rate: Custom Prometheus Queries
The stability of any proof-of-stake network is closely tied to its validator set health. With custom Prometheus queries, operators can track uptime percentages for each validator alongside churn rates – the frequency at which validators join or exit the active set. High churn may signal underlying issues such as configuration errors or hardware instability. By setting alert thresholds around these metrics, teams can proactively address problems before they cascade into consensus risks.
If you’re running multiple validators or are responsible for infrastructure at scale, these queries become indispensable for correlating individual node behavior with overall network health.
Transaction Throughput (TPS) Monitoring via RPC Stats
Throughput is more than just a bragging right; it’s a direct measure of how well Monad delivers on its promise of high-performance EVM compatibility. By leveraging RPC endpoint statistics, developers gain insight into live TPS figures across different time intervals. This data reveals not only peak performance but also periods where throughput dips due to congestion or resource contention.
Savvy teams use this information to optimize smart contract deployments and schedule stress tests when network conditions are most favorable. Combined with historical stats from tools like Grafana, RPC-based TPS monitoring forms the backbone of any serious performance engineering practice on Monad testnet.